Remote sensing technologies have made significant leaps in recent years, enabling journalists to measure vegetation indices, pollution levels, and water concentrations in specific locations using simple tools and techniques.
In this article, we demonstrate how to measure changes in vegetation cover using remote sensing techniques instead of relying solely on Google Earth Pro for visual comparisons. By following these steps, you can achieve precise analytical results:
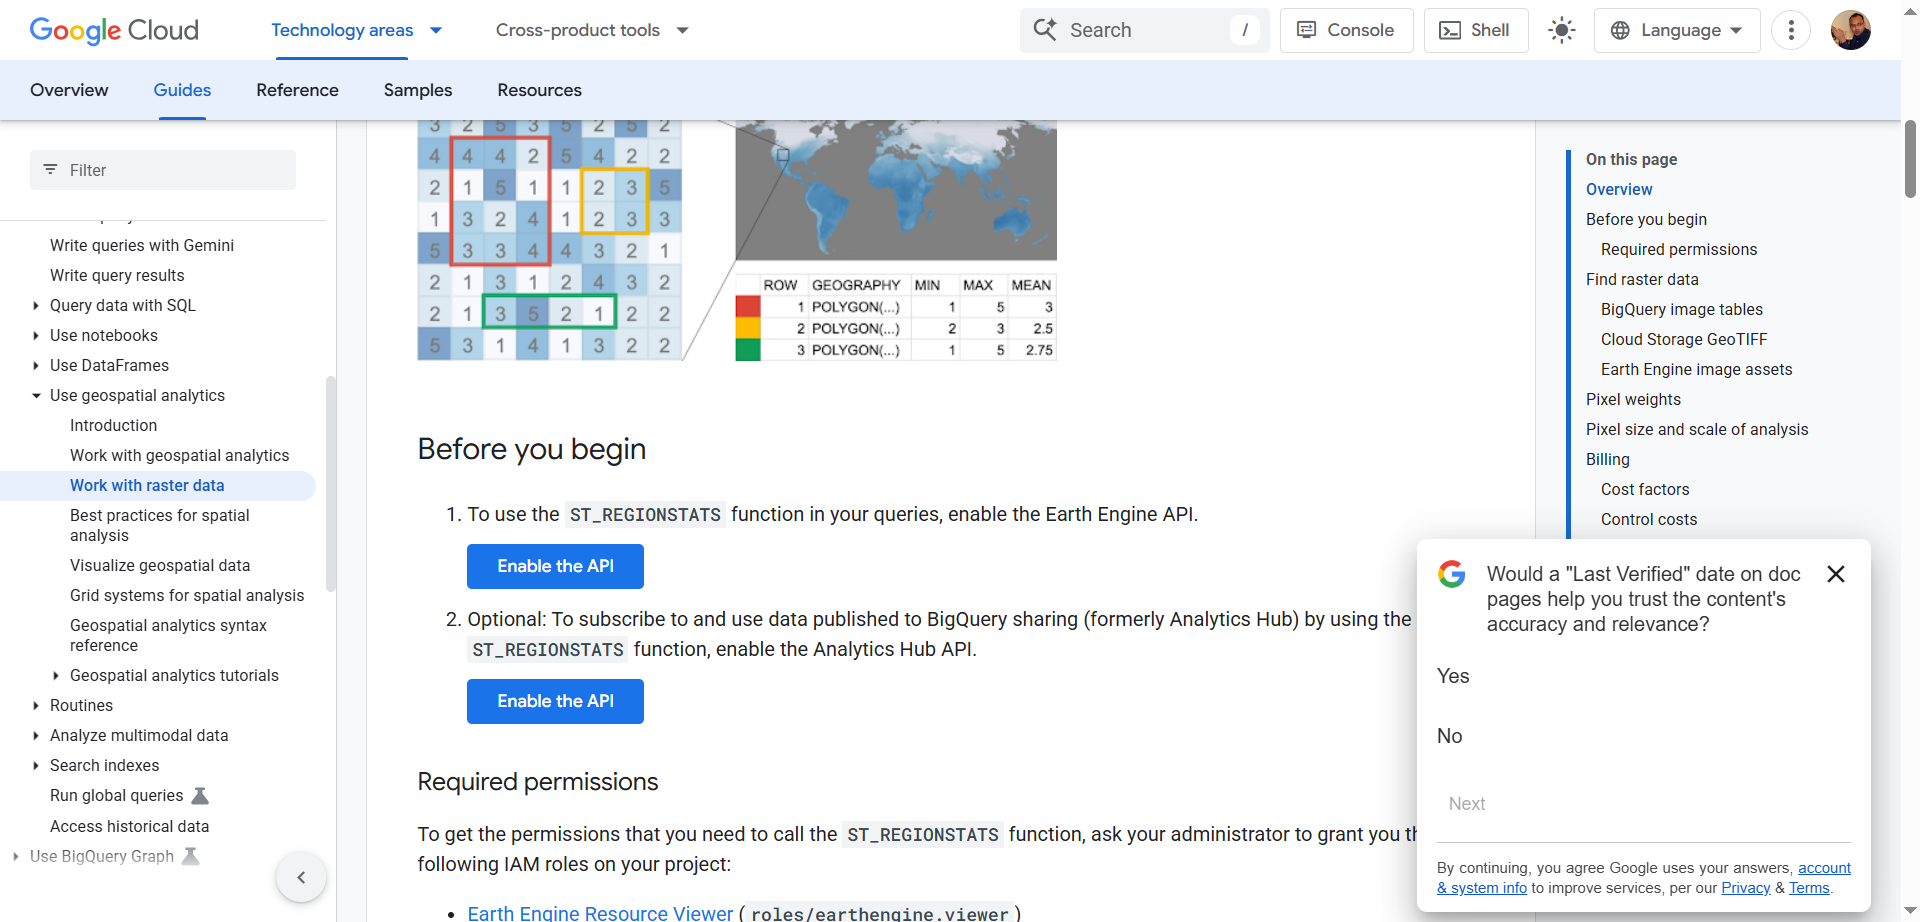
- Activate Google Earth Engine (GEE): Set up the platform via Google Cloud .
- Link Google Colab to Google Earth Engine: Establish a connection to run Python-based analysis.
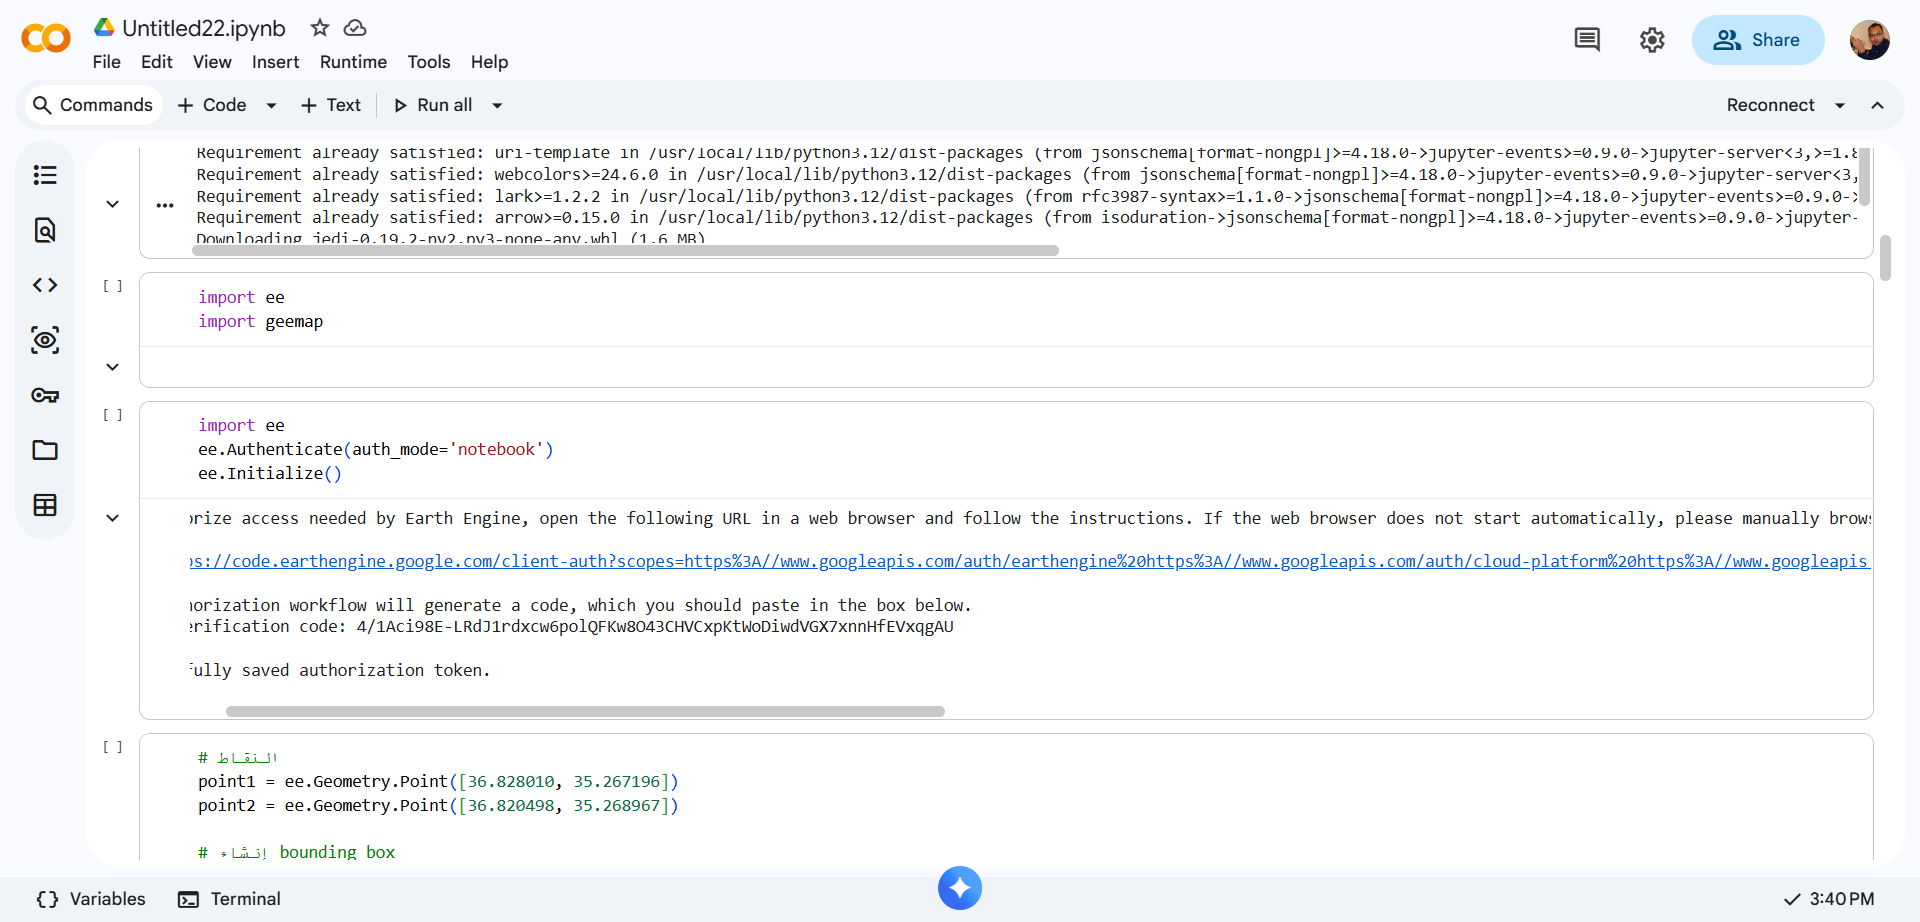
- Define Coordinates: Select the specific geographical coordinates for the site you wish to monitor.
- Set the Timeframe: Define the period for comparison—for example, analyzing Gaza before and after October 7, 2023.
- Select the Satellite Sensor: Use Sentinel-2 for recent years and Landsat for historical data.
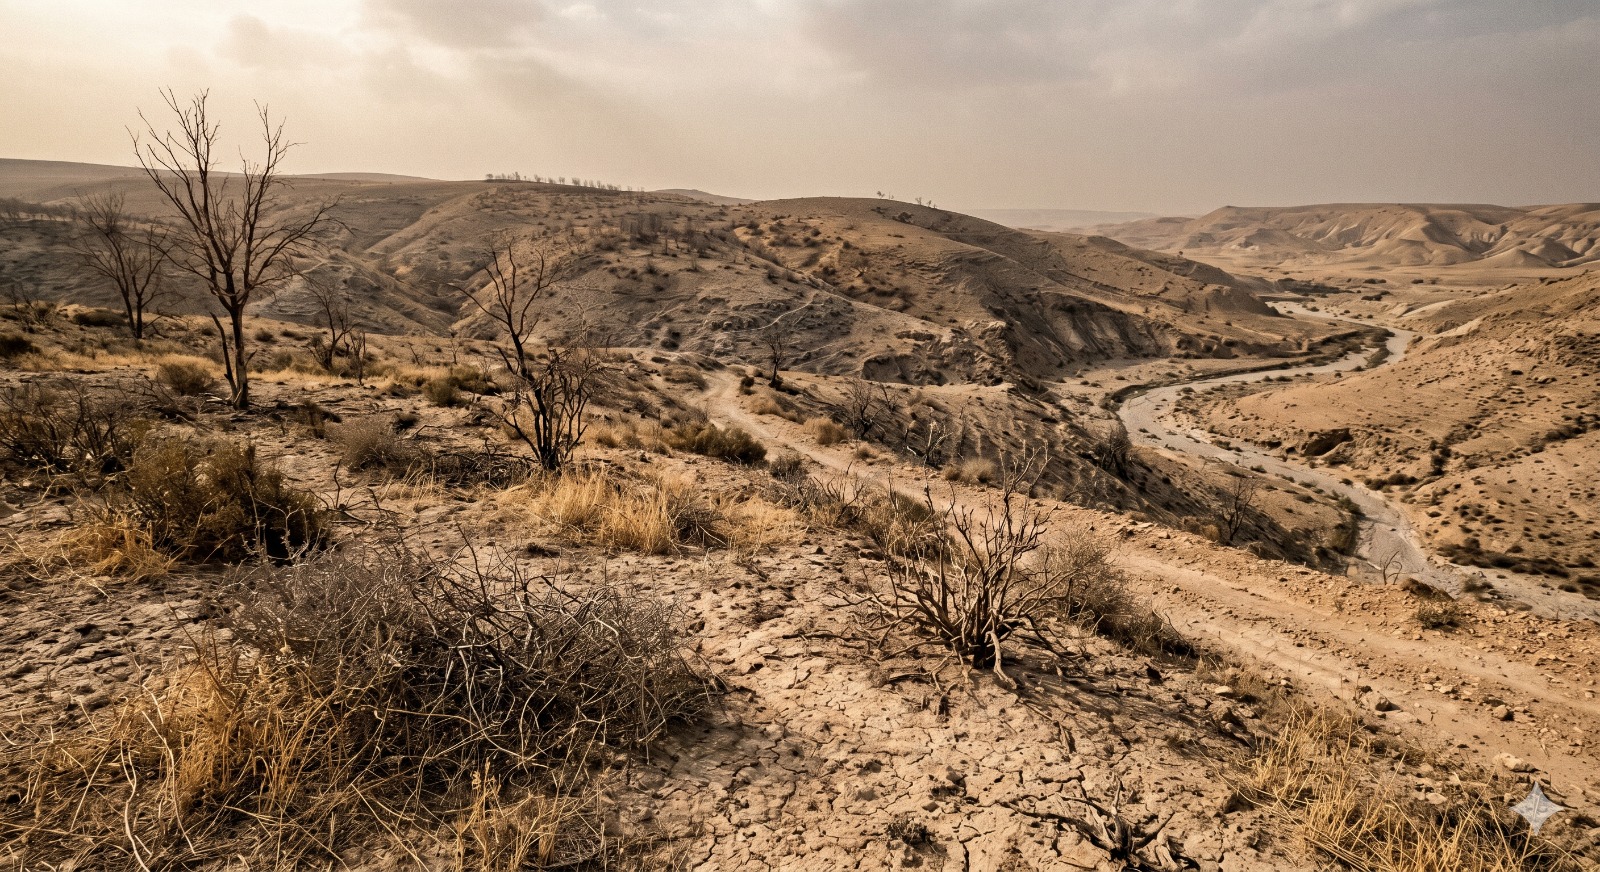
- Define the NDVI Index: > The Normalized Difference Vegetation Index (NDVI) values range from -1 to 1. Values near zero (-0.1 to 0.1) generally correspond to barren areas of rock, sand, or snow. Low positive values (approx. 0.2 to 0.4) represent shrubs and grasslands, while high positive values (approaching 1) indicate temperate and tropical rainforests.
- Set a Comparison Threshold: Use 0.3 as a benchmark; values below this are considered weak vegetation, while values above represent healthy, active vegetation.
- Seasonal Comparison: Compare data between specific seasons or across seasons, accounting for natural vegetation variance due to weather conditions.
- Image Consistency: Compare the number of available satellite images per year; a discrepancy in image frequency between two years can skew the final results.
- Cloud and Shadow Masking: Remove clouds and shadows from the data, as they interfere with the measurement of green vegetation.
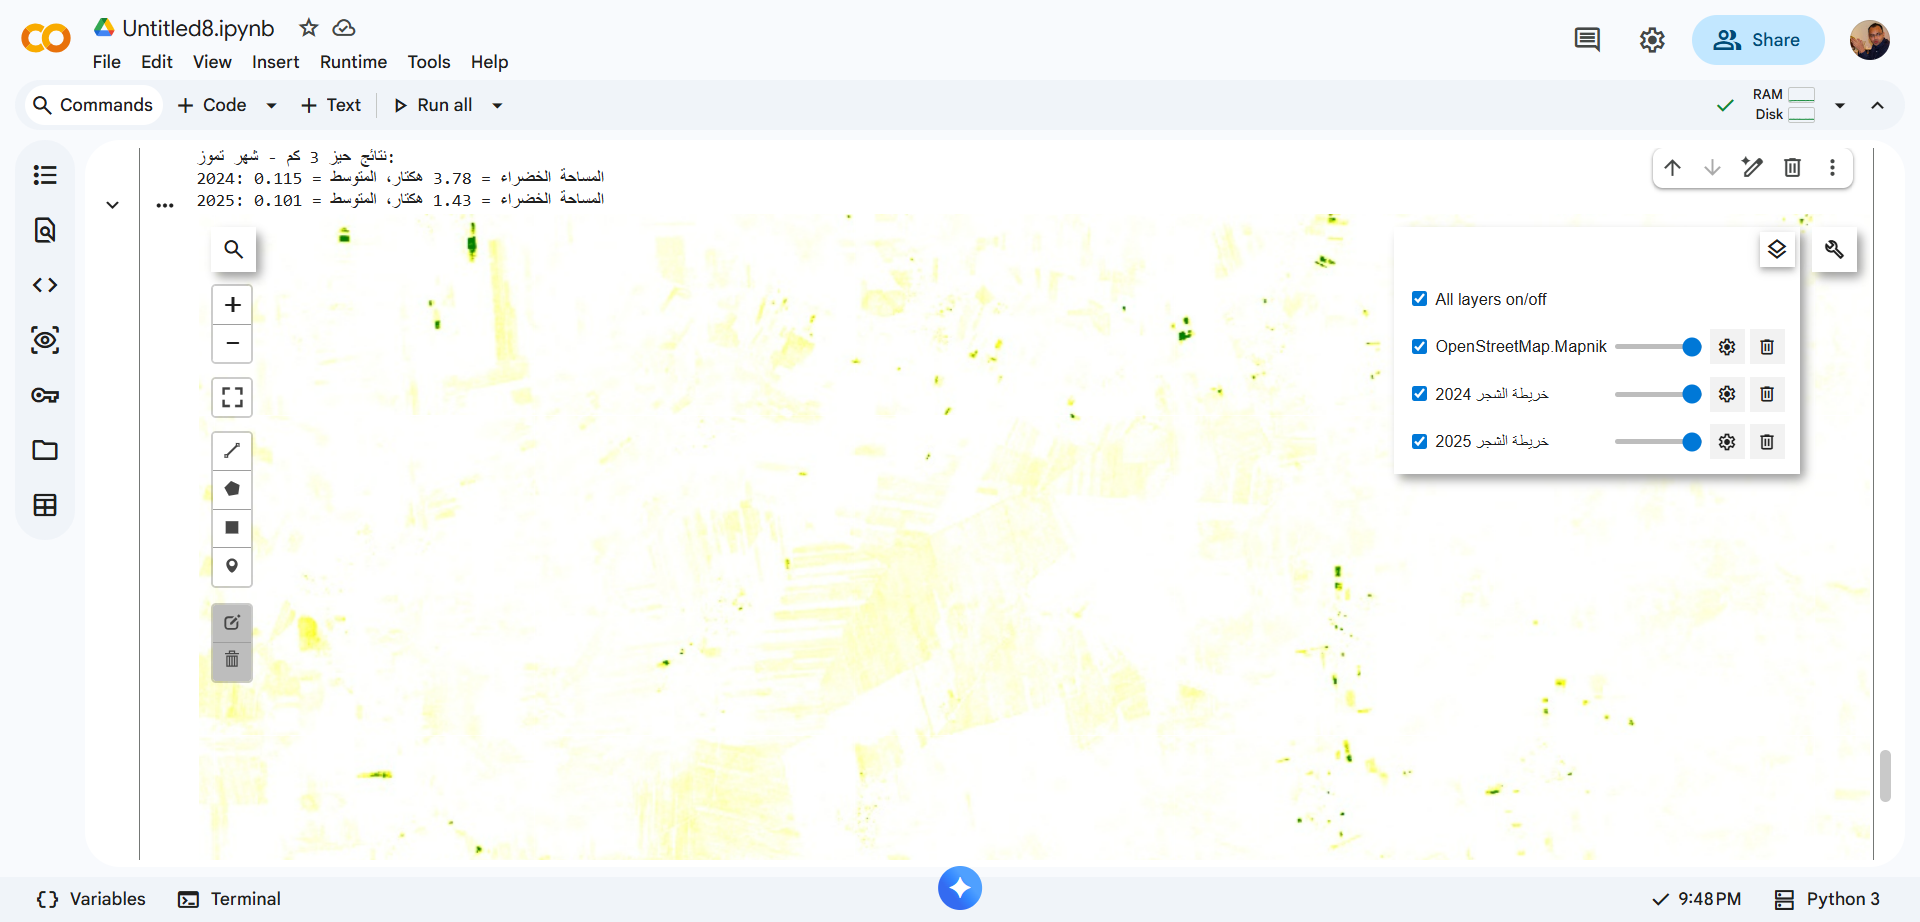
- Calculate Statistics: Determine the Mean Vegetation (the general state of the ecosystem during the year), Peak Greenness (the best vegetation state), and Minimum Greenness (the worst state) for each year.
- Calculate Change Rates: Measure the percentage of increase or decrease in cover.
- Mapping: Visualize the resulting changes on a map to clearly identify the impact on vegetation.